Data Visualization
At the heart of data lies a story waiting to be told. Our data visualization service transforms qualitative data into visually compelling stories that reveal the sentiment and experiences of your audience. Through the vibrant lens of community art, we turn the abstract into the concrete, making sense of the numbers through a burst of creativity.
Visual Stories That Speak Volumes
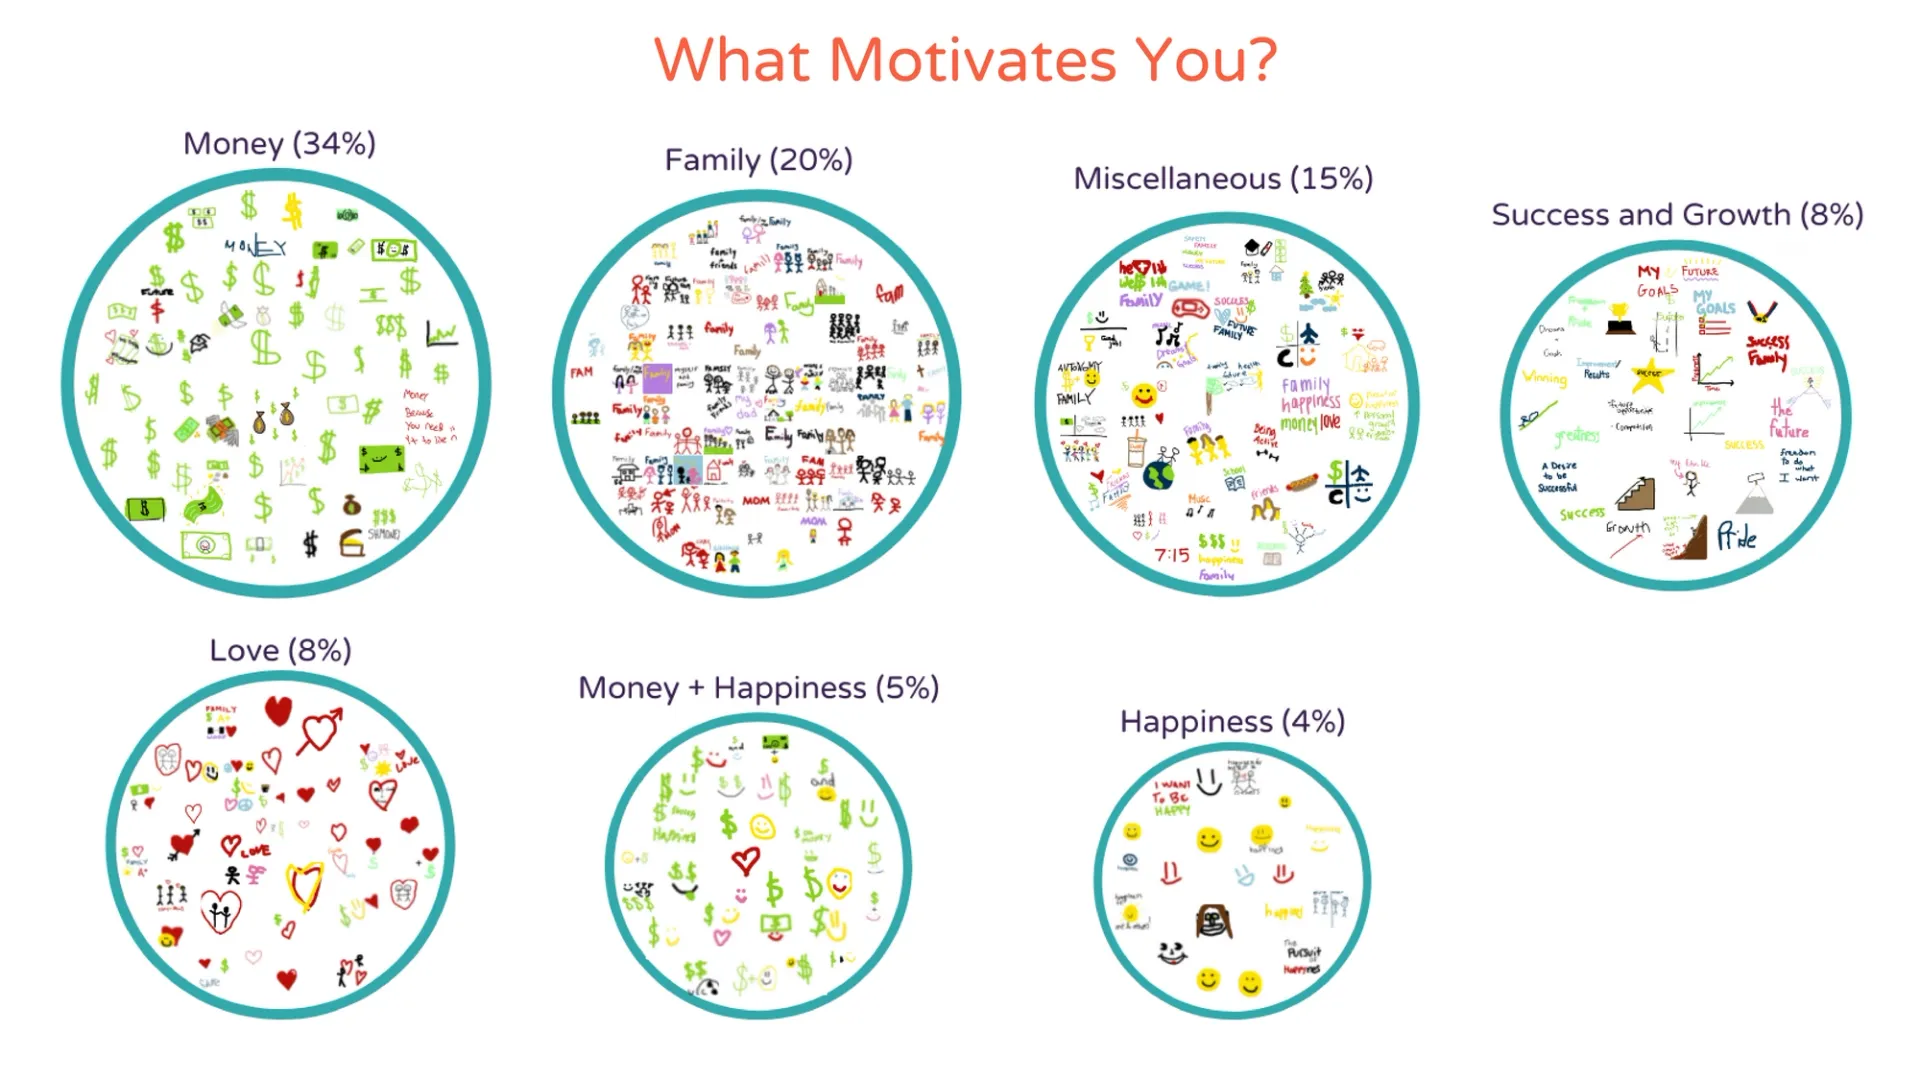
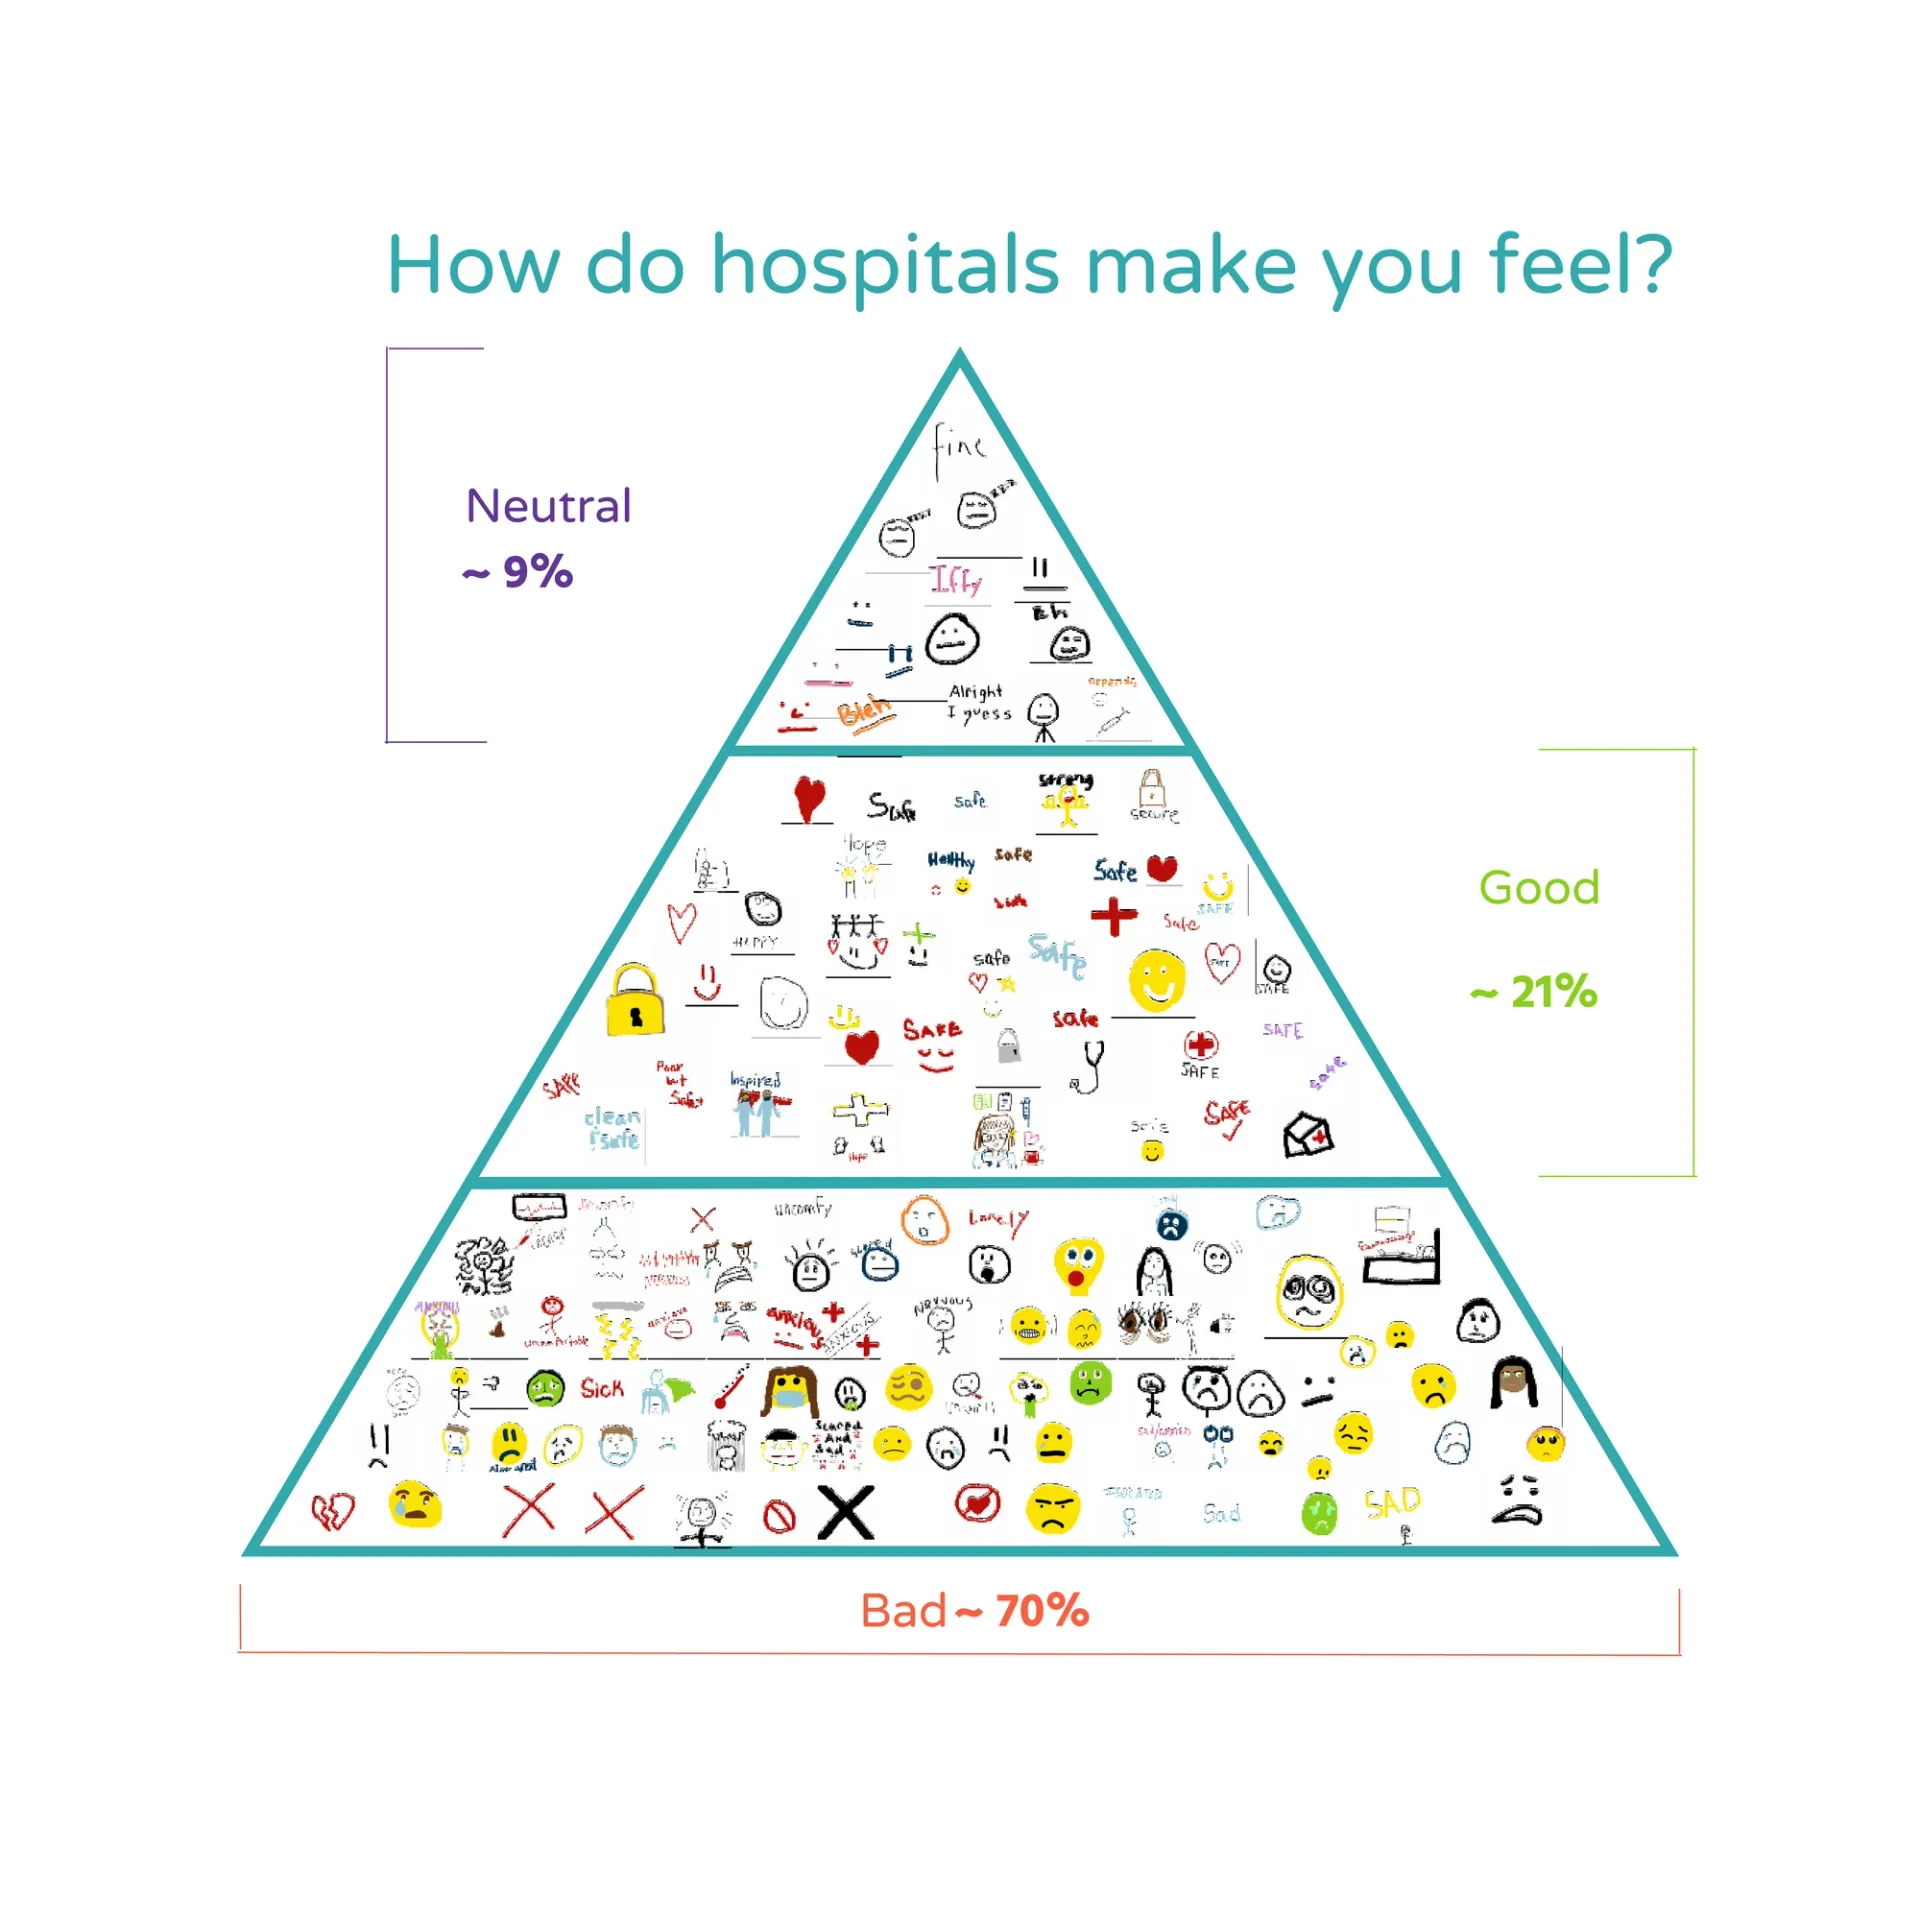
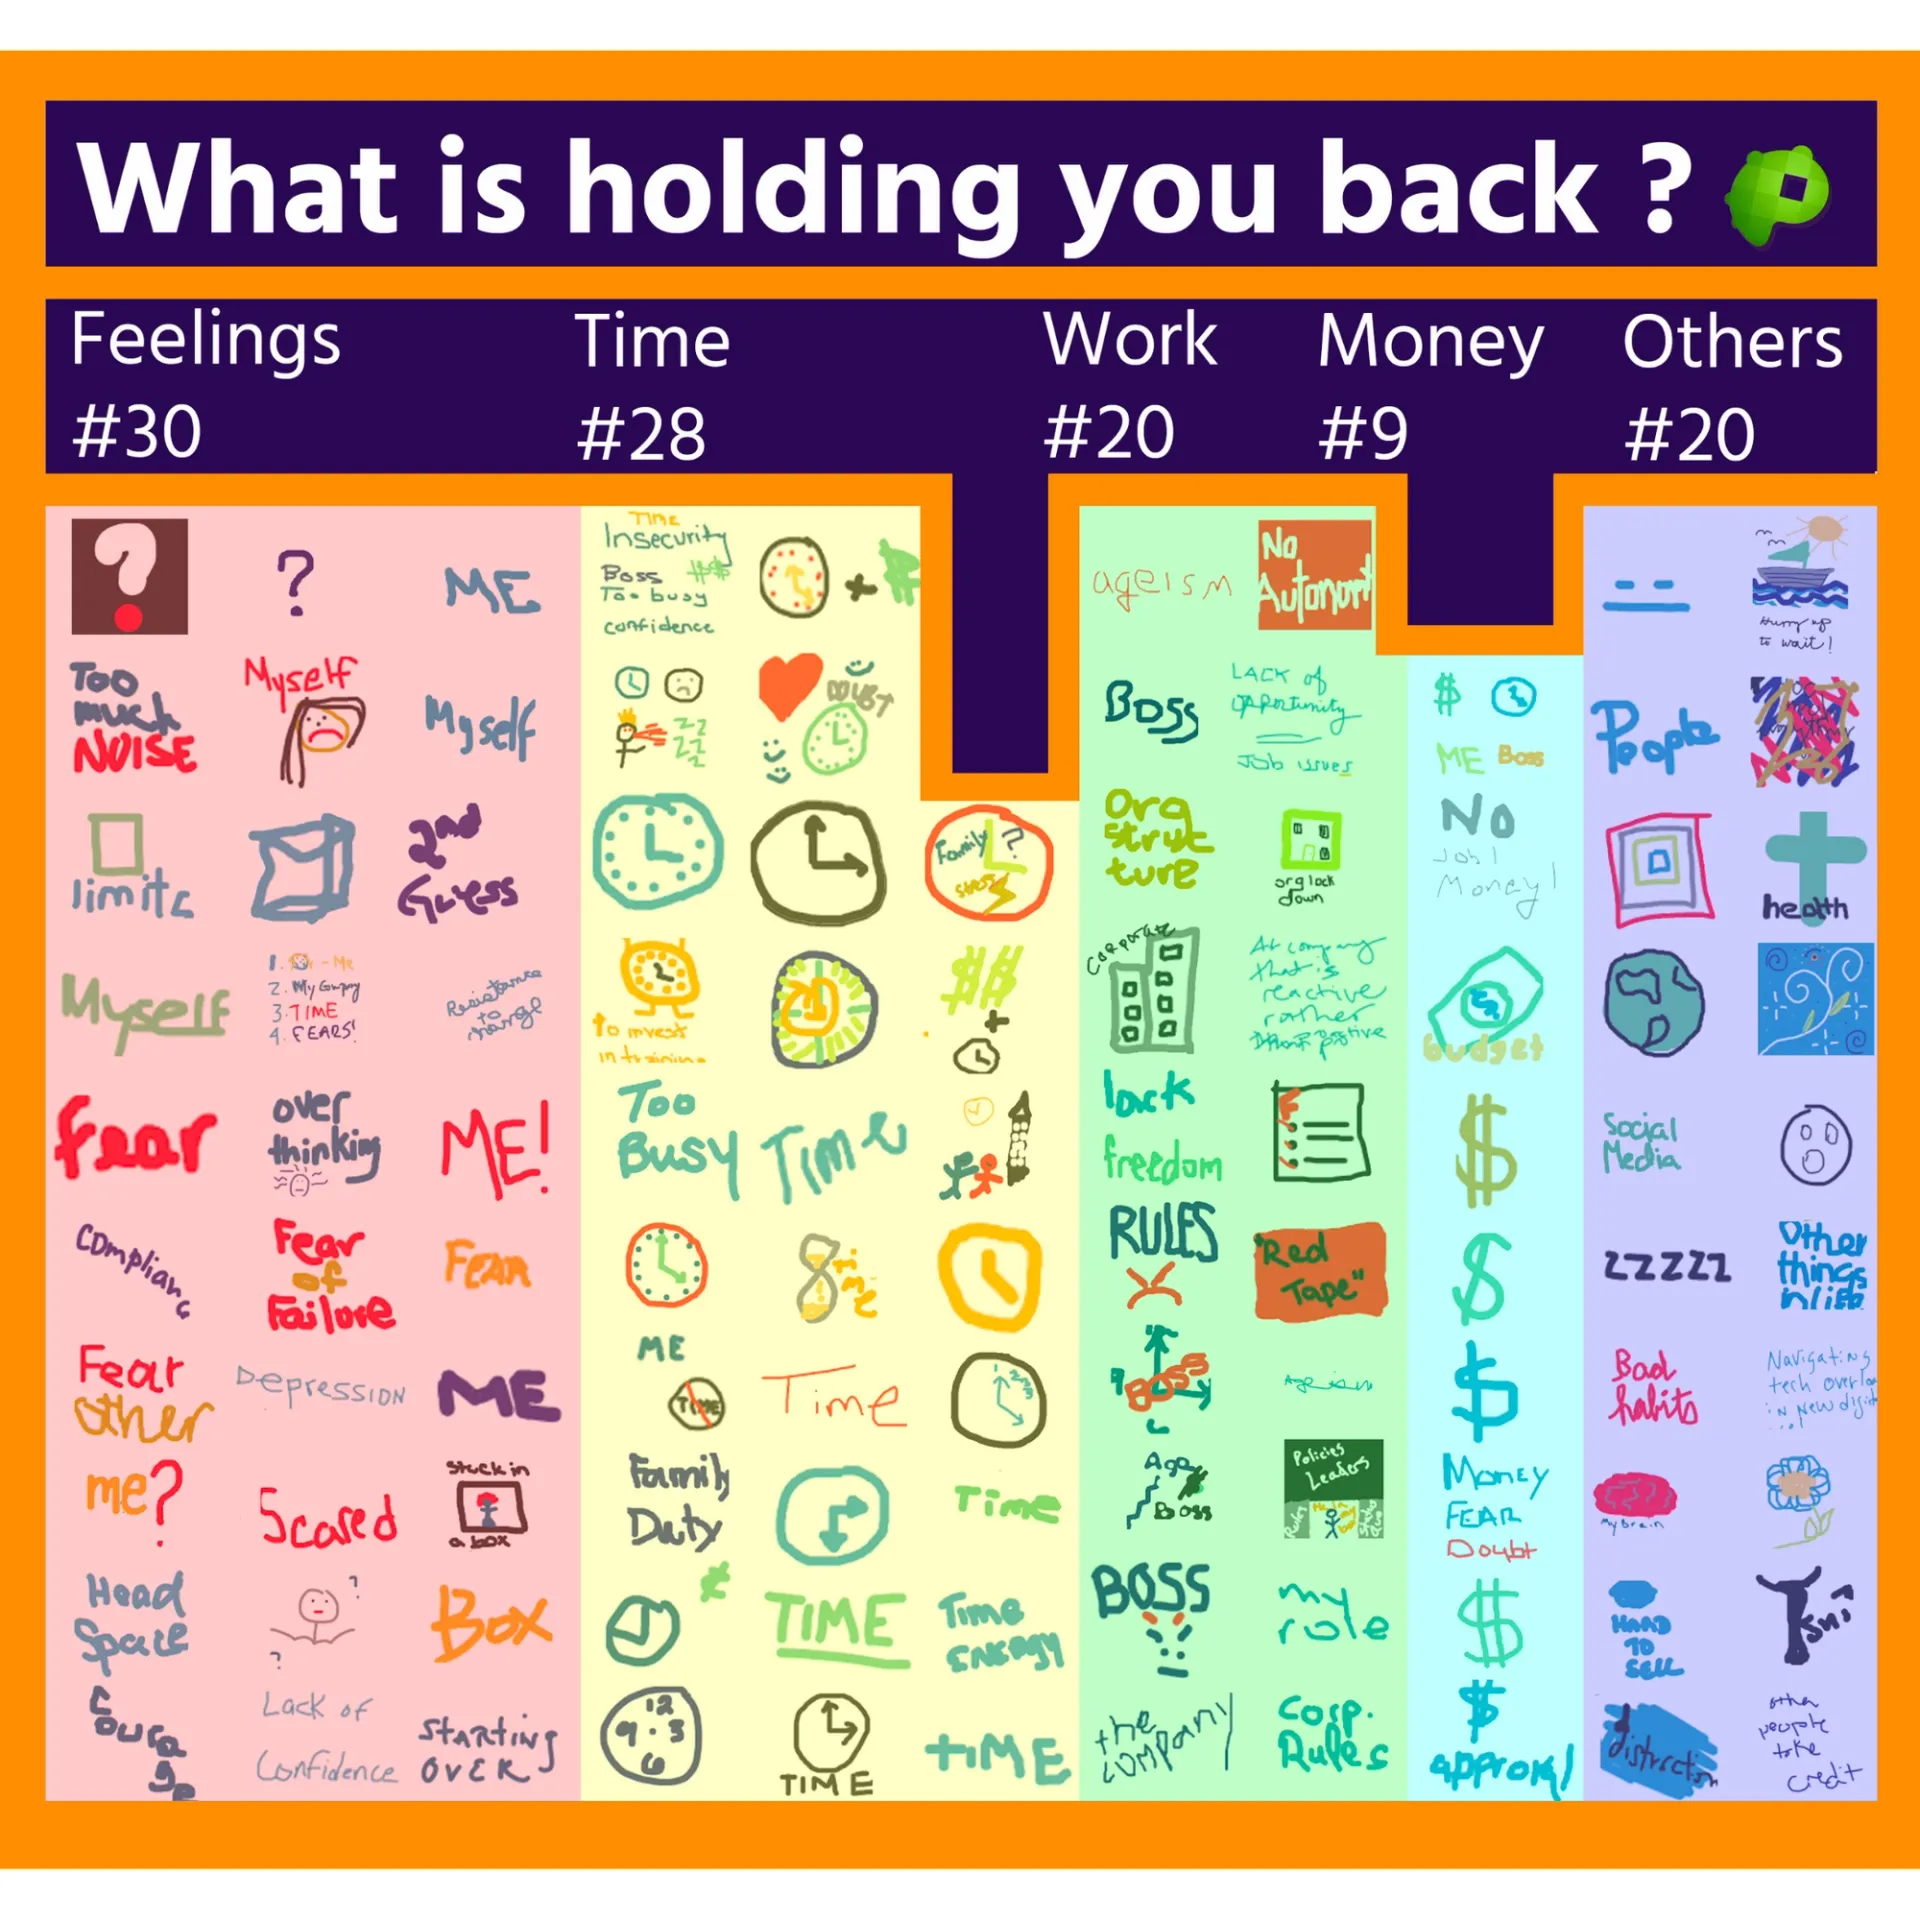
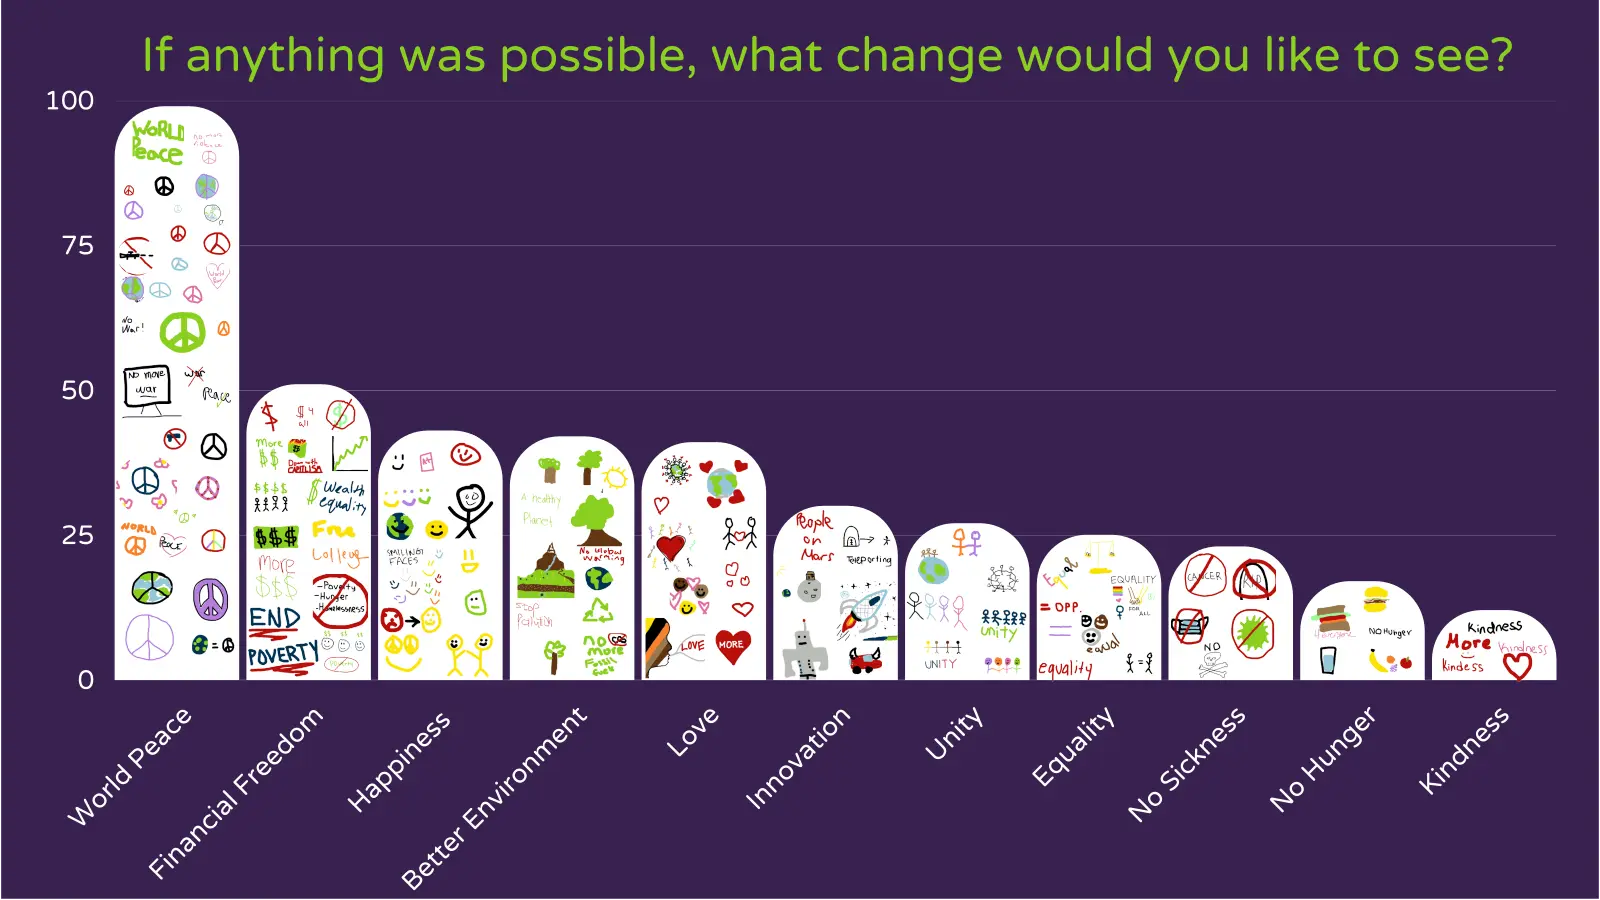
What brings people joy? What motivates them? What are their hurdles? We answer these questions not with charts and graphs alone, but with personalized art that adds color and context to the raw data. From capturing the collective joy found in nature and pets to visualizing the weight of work and time as barriers, our illustrations provide a snapshot of collective sentiment that is as informative as it is engaging.
Customized Infographics
Each visualization is custom-designed to reflect the unique responses of your audience, whether it's the warmth of family connections or the stressors of modern life. Our infographics are not just tools for understanding but also pieces of art that encourage reflection and discussion.
Engagement Through Understanding
Understanding your audience is the first step toward engaging with them meaningfully. Our data visualization process ensures that you see beyond numbers and percentages, providing a deeper connection to the thoughts and feelings expressed in your data.
Let us help you tell the story behind your data with visuals that are as telling as they are striking, capturing the true essence of your audience's voice.